
Abstract
Prediction markets allow participants to trade contracts whose payoff depends on a future event. Their prices can therefore be read as market-implied probabilities. Prediction markets have moved from a niche forecasting mechanism into broader public attention, with Polymarket as one of the most visible crypto-based examples. The platform’s blockchain-based architecture makes trading activity transparent, but the participants behind the trades remain pseudonymous. It remains unclear who these market participants are, how they differ from one another, and which groups shape trading activity on the platform.
This study examines who trades on Polymarket and how different trader types vary in their characteristics. It uses the Polymarket dataset by Wang et al. (2026) from 2 October 2020 to 17 January 2026. The analysis classifies 1,035,224 wallets into trader types using a deterministic behavioural heuristic, based on 261,649,128 trades with USD 26.86 billion in trading volume.
The results show substantial differences between Polymarket trader groups. Retail wallets represent 83.67% of all wallets but generated only 14.13% of total volume and lost USD 101.48 million in aggregate, while only 28.80% of them are profitable. Although the analysis identifies a favourite–longshot bias among Retail Traders, their positions remain comparatively accurate and lie close to those traded by Informed Traders. Whales account for only 0.90% of wallets but generate 70.58% of volume, while their aggregate profits are driven by a small upper tail of highly profitable wallets.
Polymarket’s informational value therefore coexists with substantial differences in capital, profitability, and trading behaviour across groups. The combination of accurate aggregate forecasts and heterogeneous participant outcomes is consistent with the wisdom of the crowds.
1. Introduction
Expectations about future events were traditionally shaped by polling institutes and expert forecasts. New online prediction-market platforms turn collective expectations into tradable, real-time probabilities, and Polymarket is one of their most visible examples. This section first motivates why the trader base behind these prices matters and then states the research objective and the research questions that guide the study.
1.1 Motivation and problem statement
Prediction markets have long been discussed as mechanisms for aggregating dispersed information into tradable prices (Arrow et al., 2008). In a binary event contract, the market price can be interpreted as an implied probability because the contract pays one unit if the event occurs and zero otherwise (Wolfers & Zitzewitz, 2004). This makes prediction markets relevant because their prices can be interpreted as continuously updated summaries of participants’ assessments about the outcome of a future event (Reichenbach & Walther, 2025).
The public relevance of prediction markets has increased with the rise of modern event-contract platforms (Tsang & Yang, 2026). The Iowa Electronic Markets (IEM) provided an early academic setting for political forecasting (Berg et al., 2008). Polymarket moved this mechanism into broader public use and differs from earlier markets through its combination of broad accessibility, real financial stakes, and a hybrid-decentralised technical infrastructure (Rahman et al., 2026; Tsang & Yang, 2026). Prediction-market data has also entered mainstream news coverage, as CNN integrates probability data from Kalshi, also a large prediction market, into its reporting (Kalshi, 2025).
Polymarket is especially relevant for empirical research because its blockchain and API data make the trading behaviour of individual wallets observable at a granularity that earlier prediction markets rarely offered (Reichenbach & Walther, 2025). This transparency also creates an interpretation problem because it does not reveal who the traders are. Polymarket participants trade through pseudonymous wallet addresses, so the platform shows transactions, positions, and outcomes, but reveals nothing about the individuals behind them (Cutting et al., 2025).
If prediction-market prices are used as probability estimates, the composition of the trader base matters, because a price formed by a broad and diverse crowd carries a different interpretation than one formed by a small group of capital-heavy traders. Reichenbach and Walther (2025) find that Polymarket prices are well calibrated, meaning that contracts priced at probability resolve with a relative frequency of approximately across many comparable forecasts. Because accuracy alone does not explain which trader groups produce the observed prices, who earns the gains, or whether forecast quality differs across the positions traded by different groups, this study asks: “Who trades on Polymarket?”
1.2 Research objective
This study examines the participant structure behind Polymarket prices. Prediction-market prices are commonly interpreted as aggregated probability estimates (Wolfers & Zitzewitz, 2004; Arrow et al., 2008), but this interpretation remains incomplete if the traders who generate those prices are treated as a homogeneous crowd. For Polymarket, this issue is especially important because the activity of wallets is observable while the identity, information, and motives behind them remain unknown.
The objective is to develop and apply a transparent behavioural heuristic for classifying pseudonymous Polymarket wallets into trader groups. The analysis does not aim to identify real-world persons or institutions. Instead, it uses observable trading behaviour to compare trader groups by market weight, profitability, and forecast quality.
The comparison examines whether market weight and forecast quality are broadly distributed across participants or concentrated among specific trader groups. It also relates accuracy to the distribution of gains and losses. Since Polymarket records pseudonymous wallets without identifying their owners, observable trading behaviour provides the basis for describing the platform’s participant structure.
To meet this objective, the study analyses a platform-wide Polymarket dataset covering 2 October 2020 to 17 January 2026 and classifies 1,035,224 wallets into five trader types with a deterministic, rule-based heuristic (Section 4). The analysis is guided by two research questions.
Which trader types can be identified from observable Polymarket wallet behaviour, and how do these types differ in size, activity, volume, and profitability?
How do these trader types differ in the calibration and forecast quality of their traded positions?
The central result is that market weight and forecast quality diverge strongly across groups. Whales account for 0.90% of wallets but 70.58% of volume, while retail wallets form 83.67% of the participant base, lose USD 101.48 million in aggregate, and still trade positions whose forecast accuracy lies close to that of positions traded by Informed Traders.
The remainder of the paper is structured as follows. Section 2 introduces prediction markets, forecast calibration, and Polymarket’s market design. Section 3 positions the study within the empirical literature on prediction-market participants. Section 4 describes the dataset, the heuristic trader classification, and the analysis framework. Section 5 presents the results for both research questions, which Section 6 interprets together with the limitations of the approach. Section 7 concludes and outlines future research directions.
2. Background
Prediction markets turn beliefs about future events into prices that can be interpreted as probabilities. This section connects that mechanism to forecast calibration and to Polymarket’s specific market design.
2.1 Fundamentals of prediction markets
Prediction markets are trading platforms on which participants exchange contracts whose payoff depends on the outcome of a future event (Arrow et al., 2008). In the most common design, the “winner-take-all” contract, a contract pays out one unit of the settlement currency if a specified event occurs and nothing otherwise, so that its transaction price can be read directly as the market’s collective assessment of the event’s probability (Wolfers & Zitzewitz, 2004).
In theory, prediction markets function as information aggregation mechanisms because a contract is mispriced whenever the market probability diverges from a trader’s private estimate. The resulting profit opportunity incentivises informed trading and drives prices toward their true value (Hanson, 2006). Wolfers and Zitzewitz (2004) argue that prediction markets serve three economic functions. They incentivise information acquisition, elicit the truthful revelation of private beliefs, and aggregate dispersed information into a single efficient price. The efficient-market hypothesis holds that, under suitable conditions, prices fully reflect all available information (Fama, 1970). This mechanism does not require every participant to be rational or fully informed, since the predictive quality of the price depends only on the condition that the marginal trade is executed by an informed and rational trader (Wolfers & Zitzewitz, 2004). The market weights opinions by the confidence and capital its traders commit (Berg et al., 2008). Surowiecki (2004) describes this aggregation mechanism as the wisdom of the crowds. When participants form judgements independently and the market aggregates them, individual errors can offset one another. The aggregate estimate can therefore be more accurate than many individual estimates. The wisdom of the crowds concerns the quality of this aggregate estimate and does not imply that every participant forecasts accurately or trades profitably.
Rothschild and Sethi (2015) read observed trading in prediction markets as the interaction of participants with heterogeneous priors and argue that systematic biases in those priors can leave detectable traces in market prices. Berg et al. (2008) show that political prediction-market prices often forecast electoral outcomes more accurately than known poll-based benchmarks, especially at longer forecast horizons.
2.2 Calibration of forecasts
Calibration measures the accuracy of probability forecasts by comparing market-implied probabilities with subsequently realised event frequencies, with forecasts considered well calibrated when events assigned a probability occur in the long run with frequency (Dawid, 1982).
Calibration diagrams represent this relationship graphically by grouping the observed prices into probability or price intervals. Formally, for a bucket , the average market forecast can be written as
and the realised event rate as
where denotes the probability implied by the market and denotes the outcome realised later. Under perfect calibration, each bucket satisfies (Murphy & Winkler, 1987; Reichenbach & Walther, 2025).
One summary measure of calibration is the Expected Calibration Error (ECE), which aggregates the absolute gap between mean forecast probabilities and realised frequencies across probability bins (Pakdaman Naeini et al., 2015). Lower values therefore indicate that the binned forecasts more closely match the observed outcomes.
Arrow et al. (2008) summarise the results for the IEM using an information-revelation curve. On the eve of four U.S. presidential elections, the mean absolute error of the market forecasts was about 1.5%, while the final poll stood at 2.1%. Even 150 days before the election, the mean error of the IEM was still only about 5% (Arrow et al., 2008). This is especially notable at longer forecast horizons, because polls in such phases tend to reflect current opinion rather than an actual election forecast (Berg et al., 2008).
Calibration is also relevant before a market resolves, because price development over the full market lifecycle can indicate whether systematic biases occur. One such bias is the favourite–longshot bias, in which very unlikely events are priced too high because their large potential payout appears more attractive than their actual chance of occurring justifies, whereas more likely events tend to remain undervalued relative to their real probability of occurrence (Griffith, 1949; Ottaviani & Sørensen, 2008). For Polymarket, Reichenbach and Walther (2025) report prices that are well calibrated on average but exhibit a default bias at the beginning of the market lifecycle, in which low probabilities are overvalued relative to later realised outcomes, while high probabilities are undervalued. However, they do not find a market-wide favourite–longshot bias for Polymarket of the kind known from the literature.
A comparison with the competitor Kalshi, for which Becker (2026) documents a favourite–longshot bias, shows that such patterns depend on the market environment. Prediction markets can thus provide precise and well-calibrated forecasts and have outperformed traditional opinion polls in several empirical settings (Arrow et al., 2008; Berg et al., 2008; Wolfers & Zitzewitz, 2004).
2.3 Polymarket: a platform overview
Polymarket launched in 2020 and operates a hybrid decentralised trading system on the Polygon blockchain (Rahman et al., 2026; Tsang & Yang, 2026). Although the platform has been active since 2020, it gained attention only during the 2024 U.S. presidential election and is now the world’s largest prediction market (Tsang & Yang, 2026). The market on the presidential election reached a volume of USD 3.7 billion and forecast the outcome more accurately than traditional polls (Cutting et al., 2025).
On Polymarket, users can register without a Know-Your-Customer (KYC) procedure (Swift, n.d.) and deposit stablecoin into their crypto wallet (Sirolly et al., 2026). KYC normally requires a platform to verify a user’s real-world identity before trading. A stablecoin is technically pegged to a fiat currency and is not exposed to the volatile fluctuations of other cryptocurrencies, such as Bitcoin, so one unit always corresponds to USD 1 (Lyons & Viswanath-Natraj, 2019). During the period covered by the data, this stablecoin was USD Coin (USDC). Polymarket replaced it with its own stablecoin Polymarket USD (pUSD) at a 1:1 exchange rate in April 2026. Because the dataset extends to 17 January 2026, this study uses USDC throughout. Users place forecasts with this balance by buying binary contracts, usually labelled YES and NO.
Polymarket offers markets on a wide range of questions, including the release date of a new AI model, the winner of the Swedish parliamentary elections, and the winner of the 2026 World Cup. Only Polymarket can create prediction markets on specific topics, while the broader public can submit proposals only through the social network X or the company’s own Discord server (Polymarket, 2026a).
Although these markets are generally created manually, some are generated automatically and serially for recurring events and are referred to here as series markets. The resulting market structure can be described through three hierarchical levels:
- a series recurs at regular intervals and defines the overarching framework, e.g. “Fed decision in …?”,
- an event may, but need not, belong to a series and formulates the specific question for an occurrence, e.g. “Fed decision in April”,
- a market may, but need not, belong to an event and ultimately offers users an option on which they can buy binary contracts, e.g. “Will the Fed decrease interest rates by 25 bps after the meeting in April 2026?”.
Beyond individual binary contracts, Polymarket groups markets that share a common question into categorical markets. Each option remains technically a standalone YES/NO market, but the set of options is designed to be mutually exclusive and collectively exhaustive (MECE), so that exactly one market in the group resolves YES. Instead of a single threshold question, a categorical market would enumerate the possible rate decisions (e.g. “decrease by 25 bps”, “no change”, “increase by 25 bps”) as parallel binary markets belonging to the same event. For categorical markets, Polymarket links the mutually exclusive outcome contracts of the same question so that, up to market frictions, their YES prices sum to one and can be interpreted as a probability distribution over the full outcome space (Rahman et al., 2026).
Events may also bundle thematically related but logically independent markets, in which case more than one of the contained markets can resolve YES simultaneously. Only categorical MECE markets admit this probability-distribution interpretation, whereas non-exclusive event groupings are better read as a curated list of binary contracts around a shared topic, e.g. “What does Trump say in February?”. Polymarket also attaches platform-level topic categories such as Politics, Crypto, and Sports to markets. These topic labels are used later to describe where trader groups are active.
Polymarket follows a hybrid decentralised design in which orders are matched off-chain through a central limit order book (CLOB), while settlement runs on Polygon through smart contracts that implement the market structure introduced in Section 2.1 (Rahman et al., 2026). Outcome shares are issued as ERC-1155 conditional tokens (Ethereum.org, 2026) and collateralised one-for-one by USDC, so that each outstanding YES/NO pair corresponds to one unit of stablecoin held (Rahman et al., 2026; Tsang & Yang, 2026). Complementary share pairs can be minted from, or burned against, one USDC at any time. Arbitrage enforces the constraint that a YES/NO price pair sums to one (Saguillo et al., 2025). Unlike equity markets, prediction markets are zero-sum games, because every USDC of profit corresponds to one USDC of loss. For an individual wallet, realised profit and loss (PnL) is the net amount left after sales proceeds and settlement payouts are offset against the purchase cost of the positions that have resolved.
3. Related work
Even without direct demographic data on Polymarket, the possible user group can be delimited through existing socioeconomic research. Anyone who trades on Polymarket needs knowledge of and access to cryptocurrencies and therefore operates in a niche (Auer & Tercero-Lucas, 2022). Steinmetz et al. (2021) show, based on a representative survey in Germany, that cryptocurrency users tend to be young men with good education and stable financial circumstances. They also identify knowledge of cryptocurrencies and blockchain as an important factor for ownership of and trust in the technology. Auer and Tercero-Lucas (2022) reach similar results with a study conducted in the United States and draw attention to an increasing gender gap in cryptocurrency ownership.
Reichenbach and Walther (2025) study Polymarket in terms of accuracy, biases, and individual skill on the basis of their own dataset between November 2022 and September 2025. They show that Polymarket prices are mostly well calibrated but tend toward the default option YES, especially early in the market lifecycle. Only about 28.08% of Polymarket users have positive PnL at the time of the study. The authors nevertheless find evidence of consistent profitability among individual wallets. As possible explanations, they name skill, such as informational advantages or more disciplined market selection. Successful traders tend to trade earlier, rely less strongly on the default option YES, and thereby differ systematically from retail traders. Reichenbach and Walther primarily compare winners and losers, but they do not develop a broad heuristic classification of trader types, and their dataset was not published. This study instead uses the public dataset by Wang et al. for the period from 2 October 2020 to 17 January 2026 (Section 4.1).
An early behaviour-based classification in a prediction market comes from Rothschild and Sethi (2015). The authors analyse the Intrade market for the 2012 U.S. presidential election and derive trader types from observable transaction characteristics, including trading volume, one-sided holding of contracts for Republicans or Democrats (“bias”), and holding period. They classify traders into the groups arbitrage, unidirectional traders, and biased traders. A central finding is that a large share of participants permanently trades only in one direction (“bias”) instead of flexibly switching between Obama and Romney positions. Rothschild and Sethi consider only a single market. Their metric does not transfer to a platform-wide analysis across many markets and categories, because a wallet can be active in several substantively independent markets, so no cross-market bias in the sense of the original metric can be computed.
Becker (2026) studies market roles on Kalshi, a regulated U.S. competitor of Polymarket, analysing about 72.1 million trades and USD 18.26 billion in volume through 25 November 2025. He distinguishes traders as price makers and price takers and shows a systematic wealth transfer from takers to makers. Takers achieve an average return of −1.12% per trade, and makers correspondingly achieve about 1.12%. Becker interprets this difference not primarily as superior forecasting ability among makers, but as returns from liquidity provision against systematically optimistic taker flow, which he calls an “optimism tax”. This gap varies strongly by category. Becker also finds that low-priced contracts resolve YES less often than their prices imply, so the complementary high-probability contracts appear underpriced, while the low-probability contracts appear overpriced. Becker attributes this to the favourite–longshot bias introduced in Section 2.2, which was already described in early studies of horse betting (Griffith, 1949).
Akey et al. (2026) examine wallets of winners and losers on Polymarket, with particular attention to the distribution of gains and losses. They find that trading activity is highly concentrated among a small number of large accounts, while well-calibrated aggregate prices coexist with losses for the majority of individual participants.
None of the above studies examines which trader groups are active across Polymarket and how they differ. Cutting et al. (2025) point out that the demographic characteristics of Polymarket users are largely unknown. The platform’s crypto-based infrastructure makes this gap structural. Wallet activities are publicly traceable on the blockchain, yet no information about the persons behind these accounts is recorded.
4. Method
Because Polymarket wallets are pseudonymous, the analysis cannot link accounts to the individuals behind them. It therefore uses observable trading traces to construct a clean sample, classify wallets into heuristic trader groups, and compare those groups by participation, market weight, profitability, and forecast quality.
The method proceeds in four steps. Section 4.1 defines the trade and wallet sample used for analysis. Section 4.2 adds platform-level topic categories, because the public dataset does not include them. Sections 4.3 to 4.5 define the behavioural heuristic that converts wallet features into trader types. Section 4.6 then defines the empirical measures used to answer RQ1 and RQ2.
4.1 Dataset and selection criteria
Before trader groups can be compared, the raw Polymarket records must be restricted to markets and wallets that support consistent measurement. This study uses the dataset by Wang et al. (2026), which contains market, transaction, and user data from 2 October 2020 to 17 January 2026 and comprises 293,333,497 trades and 1,767,516 wallets. At the trade level, a typical record links a wallet address to a market identifier, a timestamp, the traded outcome token, the execution price, the traded amount, the USD value, and the maker or taker role of the wallet.
Figure 1 presents a graphical overview of how the trade and wallet inputs move through data selection into analysis. The upper path cleans the trade records through basic cleaning and the resolved-market filter, while the lower path restricts the wallet population through the minimum-activity filter and wash-trading detection (Steps 1–2). Both paths converge in the heuristic classification (Step 3), which assigns each retained wallet to a trader group. The resulting groups then feed the analysis for RQ1 (Step 4a) and RQ2 (Step 4b).
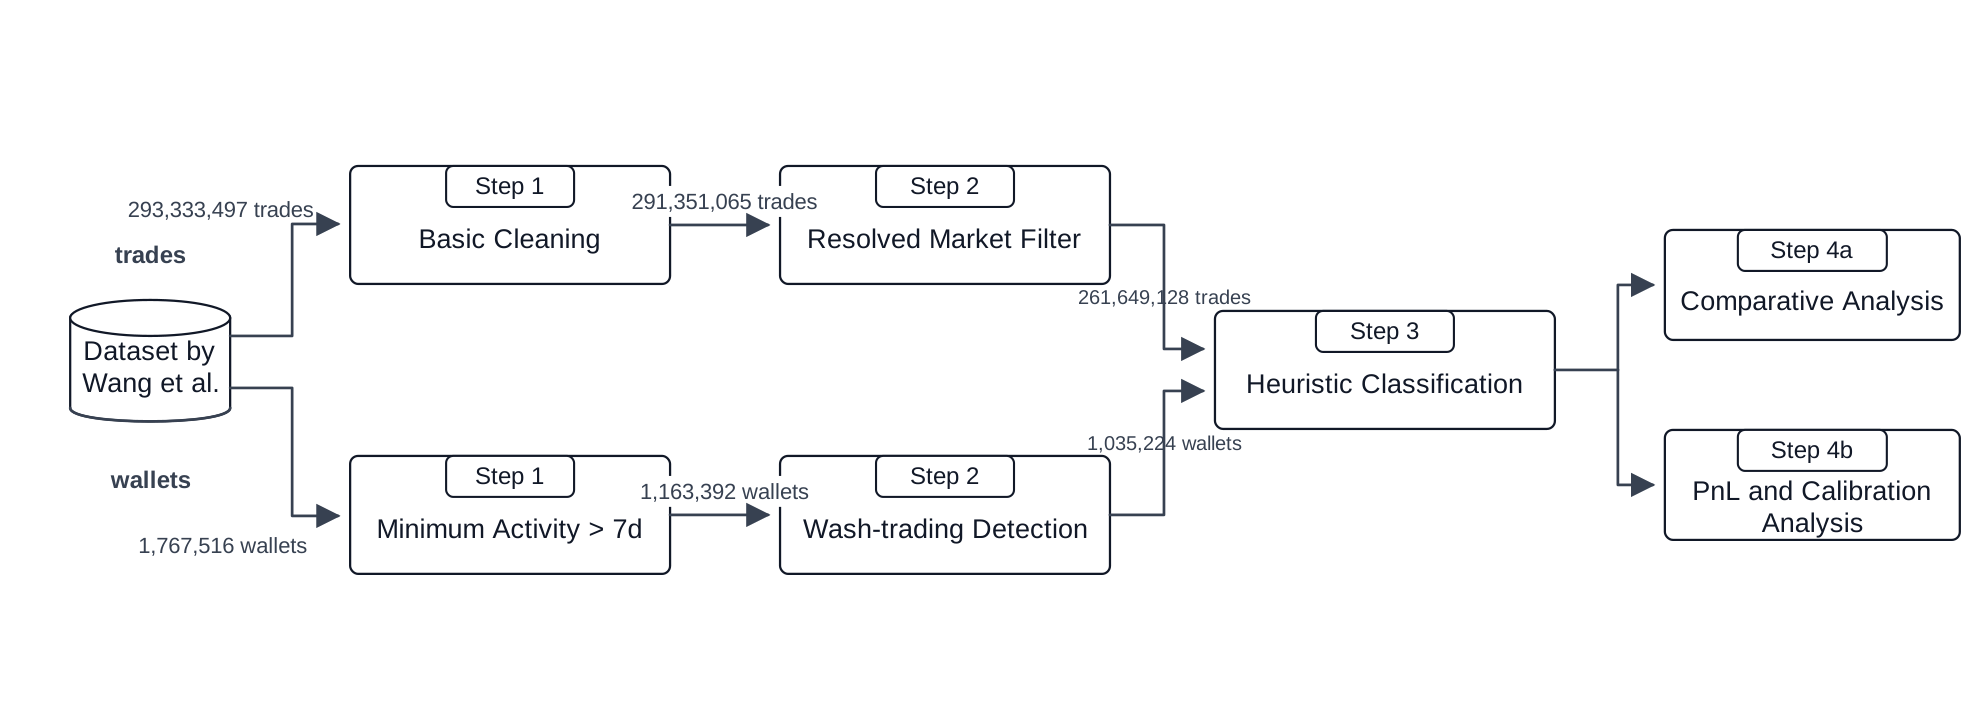
The trade track begins by removing malformed records that cannot be linked to valid trades. This step retains only trades with a valid price , an existing contract side, and a positive transaction value. Such malformed records would inflate both the trade count and the observed USD volume without representing genuine market activity. After this cleaning, 291,351,065 of the original 293,333,497 trades remain.
The second filter limits the sample to resolved binary markets, since evaluating Polymarket’s historical forecast accuracy requires a known outcome. Each binary market has the complementary outcome tokens YES and NO. Upon resolution, the winning token redeems for USD 1, while the losing token becomes worthless. This restriction retains 238,848 resolved binary markets. Matching these markets with the cleaned trade data produces the final analysis dataset, which comprises 261,649,128 trades with a total trading volume of USD 26.86 billion.
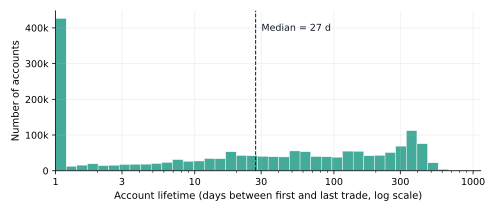
The wallet track begins with the minimum-activity filter, which removes wallets whose trading lifespan is shorter than seven days. The account-lifetime distribution is strongly skewed toward short-lived wallets (Figure A1), which introduce noise and rarely exhibit a stable behavioural pattern that the heuristic could classify. This filter excludes 604,124 wallets and leaves 1,163,392 wallets.
The second wallet step, wash-trading detection, flags and removes wallets that engage in wash trading. Wash trading means arranged or self-offsetting trades that create apparent activity without a genuine change in economic exposure, artificially increasing both the trade count and volume (Sirolly et al., 2026). This study applies the wash-trader classification proposed by Sirolly et al., which is detailed in Section 4.4. The classification flags 128,168 wallets and leaves 1,035,224 wallets as the sample for the main results.
4.2 Category enrichment via the Gamma API
The dataset by Wang et al. does not include platform-assigned market categories, so these topic labels were added separately. Additional market information was retrieved through the Polymarket Gamma API. These topic data describe the composition of the analysis sample and allow the activity of the trader groups defined in Section 4.4 to be compared across categories. Markets are grouped into Politics, Crypto, Sports, Entertainment, Finance, Esports, and World Events, using the category fields returned by the Gamma API. Markets without a clear assignment are categorised as Other.
Table 1 shows how the resolved binary markets in the analysis sample are distributed across these topic categories. It reports the subset of markets that can be linked to the trader-group composition after the exclusion of wash-flagged wallets. The volume column is based on cleaned trade-table volume rather than maker/taker position legs, so it is directly comparable to the aggregate trade volume reported above. Crypto and Sports contain the most markets in this analysis sample, while Politics accounts for the largest share of trading volume. The market counts reflect the automated, serial market creation described in Section 2.3. Sports markets can be created from scheduled match data across different sports, while recurring Crypto series markets such as “BTC Up or Down 5-Min” can be opened without a manually formulated question. The volume share of Politics is consistent with the public salience of political outcomes. The 2024 U.S. presidential election market alone reached a trading volume of USD 3.7 billion (Section 2.3). The remaining categories play a smaller role in both market availability and traded volume.
| Category | Markets | Markets (%) | Volume (bn USD) | Volume (%) |
|---|---|---|---|---|
| Crypto | 76,073 | 37.41 | 5.12 | 19.06 |
| Sports | 60,819 | 29.91 | 7.58 | 28.22 |
| Politics | 13,100 | 6.44 | 7.96 | 29.62 |
| Esports | 7,060 | 3.47 | 0.56 | 2.09 |
| Entertainment | 5,231 | 2.57 | 0.78 | 2.91 |
| World Events | 11,998 | 5.90 | 1.35 | 5.02 |
| Finance | 6,276 | 3.09 | 1.44 | 5.37 |
| Other | 22,805 | 11.21 | 2.07 | 7.71 |
| Total | 203,362 | 100.00 | 26.86 | 100.00 |
4.3 Feature extraction from transaction data
Because Polymarket traders act without identity verification (KYC) or demographic disclosure, the analysis cannot classify people directly and instead uses a transparent set of deterministic rules to assign wallets to trader groups from observable behaviour. Trader classification is performed separately for each wallet on the basis of transaction data, meaning the executed trade records described in Section 4.1. For each wallet, the analysis computes the following features:
- account lifetime, measured as the time between the first and last trade,
- number of trades and number of traded markets,
- total trading volume in USDC,
- maker ratio, measured as the share of trading volume executed as maker,
- median holding period,
- win rate based on realised positions,
- realised PnL in USDC.
Account lifetime defines the minimum-activity filter in Section 4.1 and is used to exclude wallets with fewer than seven days between their first and last observed trades before group classification.
Trading volume and the number of markets capture the scale differences emphasised by Rothschild and Sethi (2015), Kirilenko et al. (2017), and Akey et al. (2026).
Maker ratio captures liquidity provision. Following Rothschild and Sethi (2015) and Kirilenko et al. (2017), median holding period and trade count capture short-horizon and high-frequency trading behaviour. Using the median rather than the mean limits the influence of unusually long individual positions; the implications of this choice are discussed in Section 6.4.
Win rate and realised PnL connect the classification to the profitability differences documented by Reichenbach and Walther (2025), Becker (2026), and Akey et al. (2026).
Other possible signals, such as order cancellations or funding-wallet links, are not used, because the classification is restricted to the executed market, transaction, and wallet fields available in the public dataset. Because Polymarket is a zero-sum market without transaction fees (Section 2.3), realised PnL measures redistribution between participants rather than value creation.
4.4 Classification by observable behaviour
Each wallet is assigned to exactly one trader type. The labels are behavioural proxies for unobserved trader roles and are assigned from observable measures. The groups are Wash Traders, Market Makers, Algorithmic Traders, Whales, Informed Traders, and Retail Traders. Wallets with a dominant share of wash-flagged trades are excluded from the comparative analysis. This is in line with Sirolly et al. (2026), who treat wash trading as artificial market activity that should be separated before interpreting ordinary participation. Because a wallet receives only a single label, structural roles, especially liquidity provision, take precedence over performance-based labels. The rules therefore use the following fixed priority order:
The classification is deterministic and follows prior empirical market-microstructure studies that classify traders by observable trading behaviour (Rothschild & Sethi, 2015; Kirilenko et al., 2017).
The Wash Trader group is applied first, because wash trading can mechanically inflate both transaction counts and trading volume, thereby biasing all subsequent volume- and activity-based measures (Sirolly et al., 2026). Following Sirolly et al., the analysis assigns each wallet an initial score based on repeated position-closing behaviour and then updates this score through the wallet–counterparty trading network. The approach does not require real-world trader identities and assumes that Wash Traders repeatedly open and close positions mainly against other wallets in the same suspicious trading cluster. For each wallet , the analysis computes the share of total trading volume that occurs in wash-flagged trades as . A wallet is a Wash Trader if
The threshold requires wash-flagged trades to account for at least half of the wallet’s observed trading volume. The rule therefore treats suspicious activity as dominant only when it constitutes a majority of that volume.
The Market Maker rule is applied next. Market Makers provide liquidity by posting limit orders to the order book that can be executed by other market participants. They are identified by the maker ratio,
A wallet is classified as a Market Maker if
The activity threshold uses the 97th percentile of the trade-count distribution, because Market Makers should appear in the exceptional upper tail of trading frequency rather than merely above the average wallet. The 97th percentile keeps the rule stricter than a broad upper-tail cutoff while still leaving enough wallets for group-level comparison. The sensitivity analysis confirms that the main results remain stable when this cutoff is varied (Section 4.5). Kirilenko et al. (2017) provide the conceptual precedent by identifying high-frequency traders through exceptional trading activity, but the numerical cutoff used here is calibrated to the Polymarket wallet distribution rather than imported from their futures-market setting.
The Algorithmic Trader group captures wallets with automated or algorithmic trading patterns. These wallets are defined by high activity, short holding periods, and a maker ratio below the market-maker threshold:
Algorithmic trading is also expected to appear in the upper tail of the trade distribution, similar to Market Makers. The holding-time threshold is motivated by Rothschild and Sethi (2015), who classify arbitrage in prediction markets by a median holding period of less than ten minutes. A maker ratio of at most 0.96 separates these traders from Market Makers.
The Whale rule identifies capital-intensive traders that are not primarily Market Makers:
This rule selects the largest traders by realised dollar volume. Rothschild and Sethi (2015) show that the most active one percent of traders generated a disproportionate share of Intrade trading activity. This is consistent with Kirilenko et al. (2017), who distinguish large buyers and sellers from small traders by their much larger trading volume. The maker-ratio condition prevents high-volume Market Makers from being classified as Whales.
The Informed Trader rule identifies wallets with above-average realised success and enough trading activity for that success rate to be meaningful:
The thresholds assume that Informed Traders achieve above-average success rates and trade sufficiently often (Rothschild & Sethi, 2015; Kirilenko et al., 2017). The additional condition on the median trade count reduces the risk of classifying a wallet as an Informed Trader because of a small number of lucky trades. Akey et al. (2026) define insider trading as trading “on non-public material information about a resolving event”, as distinct from informed trading, which describes any trade in which a participant holds superior information about an outcome, whether from a quantitative forecasting model, domain or event-specific expertise, or other legitimate sources.
All remaining wallets are classified as Retail Traders if no previous rule applies.
4.5 Validation of trader types
The robustness of the trader classification is evaluated with the same metrics that answer the research questions. These include, in particular, group-specific shares of wallets and volume, the share of profitable wallets, mean PnL, and the calibration metrics defined in Section 4.6.
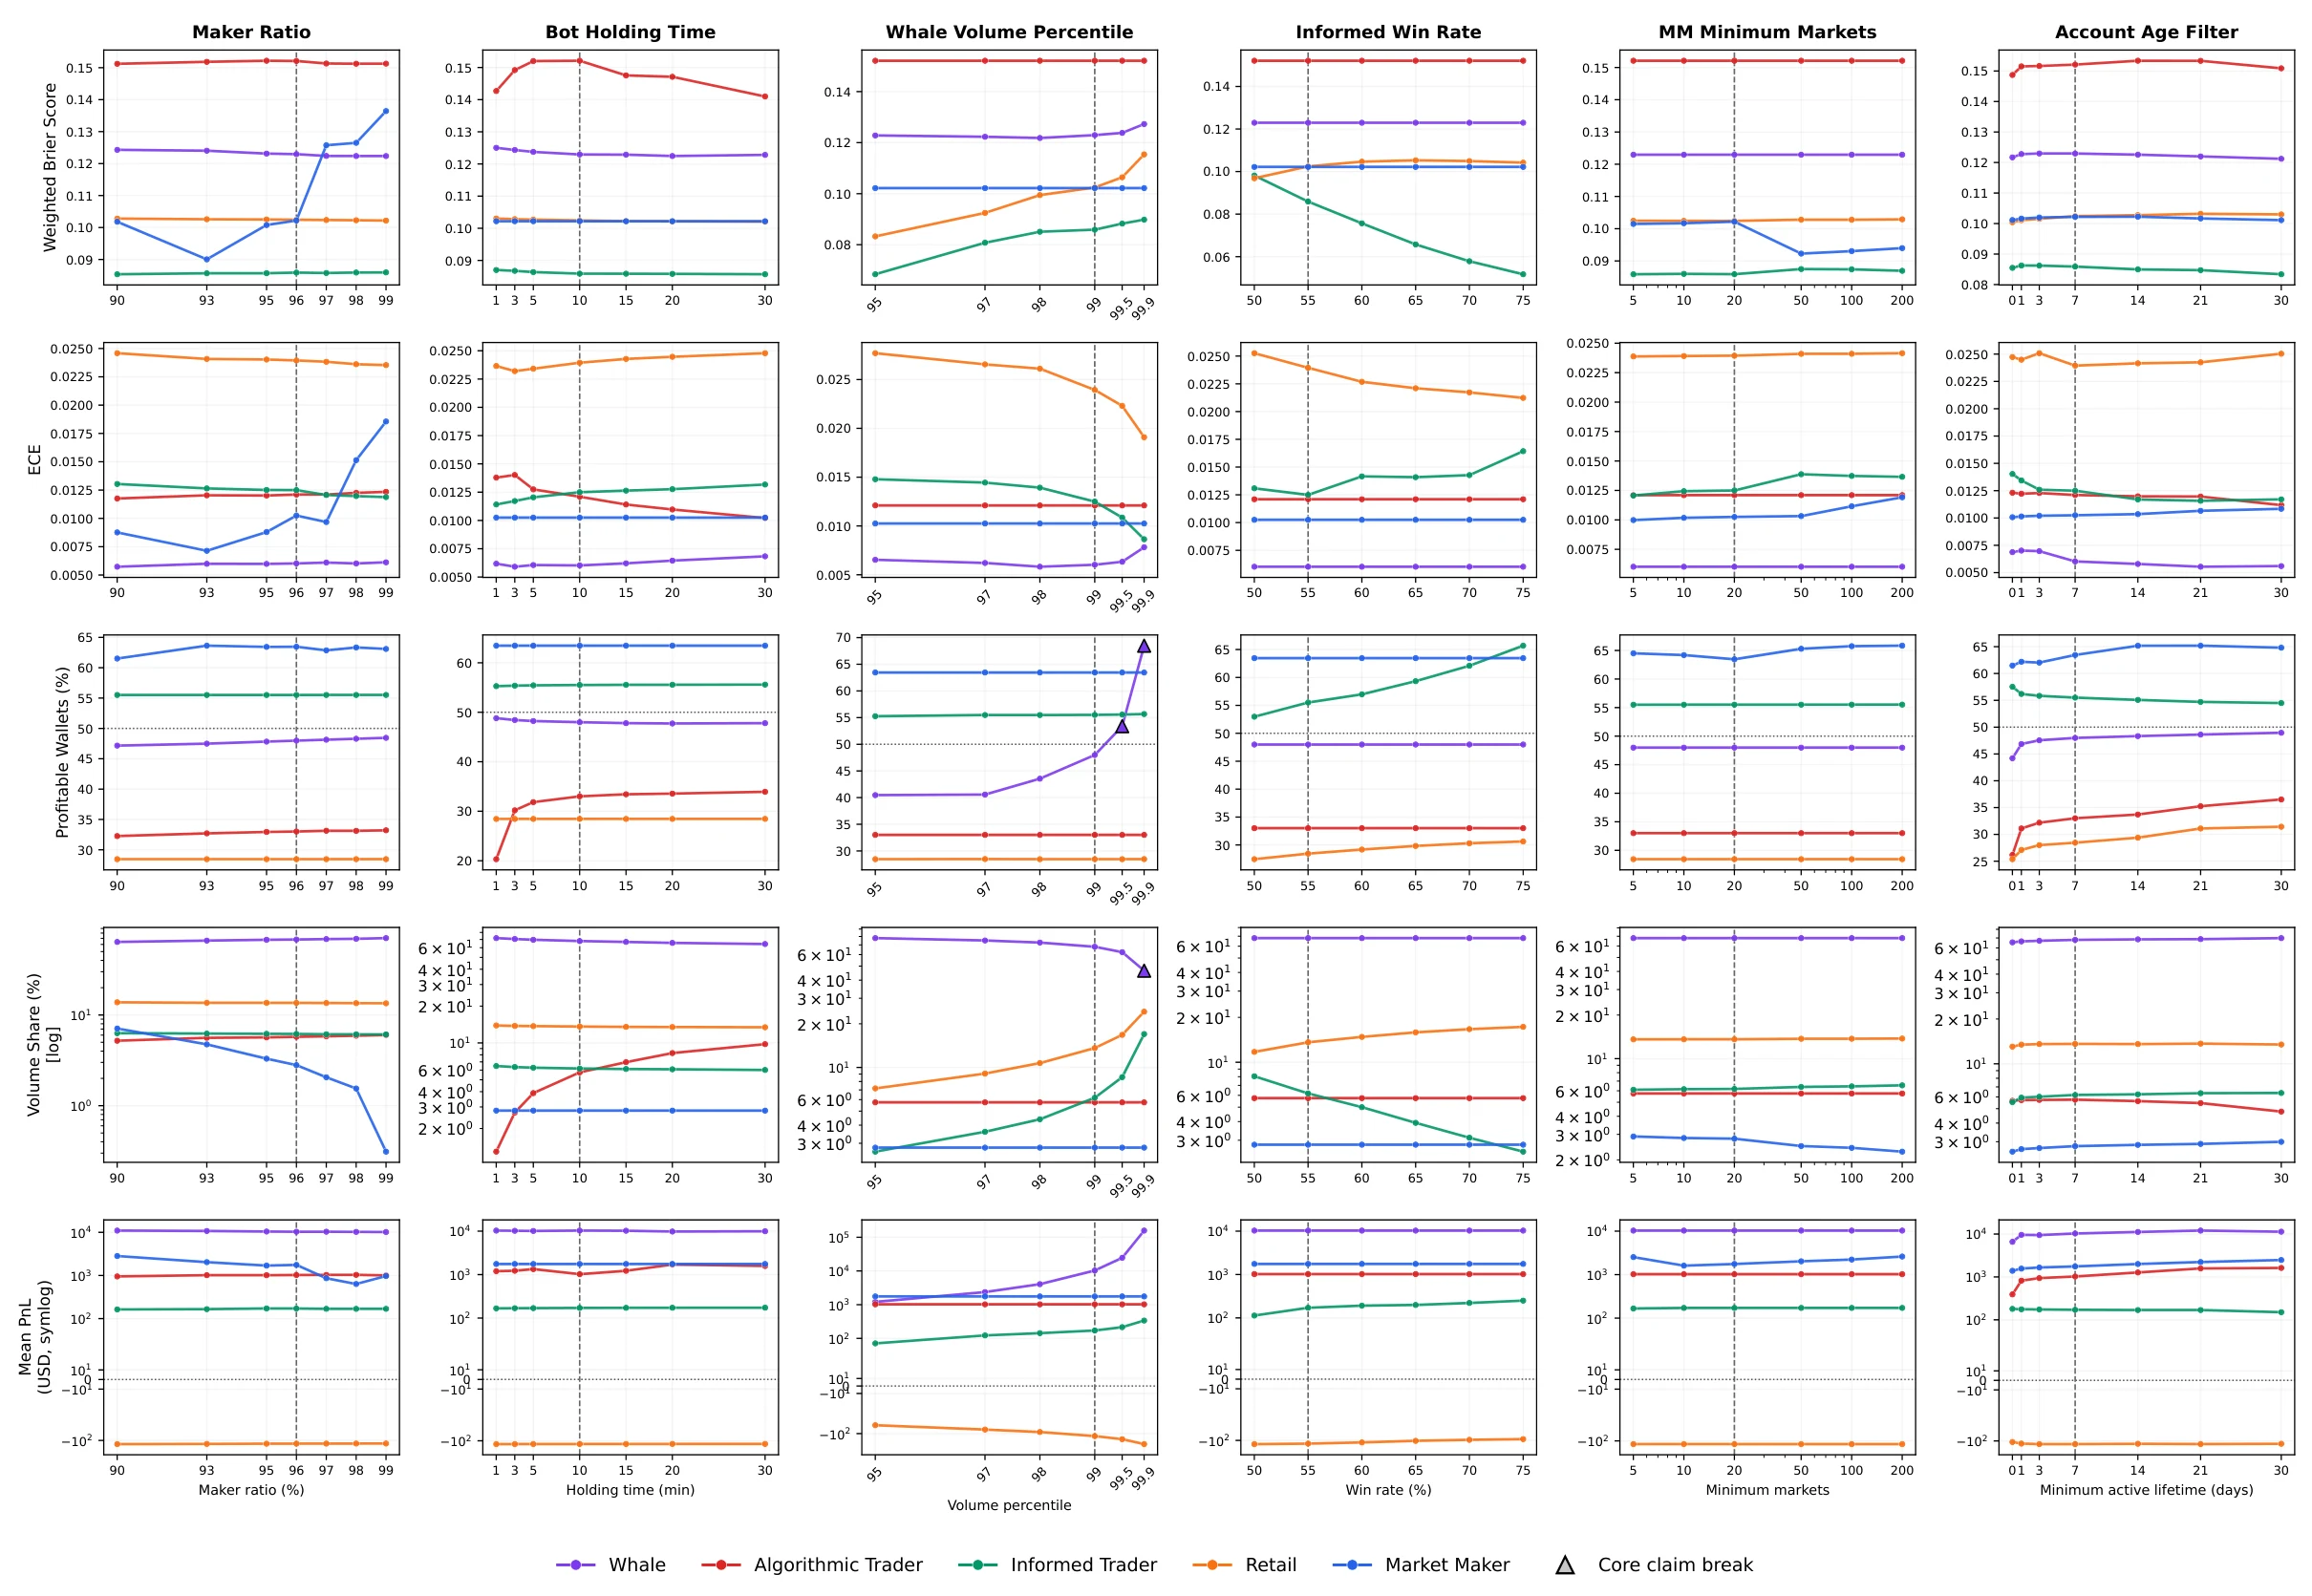
The sensitivity analysis varies each heuristic parameter separately when that parameter delimits only one trader type. The analysis also varies the minimum account lifetime to test how this requirement affects the group structure and the results.
The robustness checks show that the core statements remain stable across realistic parameter ranges. An exception arises only when the whale percentile is set to 99.5 or higher. Because the whale category is conceptually intended to capture “the one percent” of wallets on Polymarket, the 99th percentile remains the substantively appropriate threshold. Around this threshold, variations in the remaining group-specific parameters change neither the direction nor the interpretation of the central results. The appendix reports the full sensitivity overview for all varied parameters (Figure A2).
4.6 Analysis framework
After classification, each wallet group is evaluated through the same empirical dimensions: realised PnL and profitability, activity and volume, and forecast quality. These metrics link the heuristic labels to the two research questions.
Realised PnL and profitability. Profitability is measured separately for each wallet using realised PnL in USDC. For each wallet , PnL is reconstructed over the resolved binary markets traded by that wallet by netting realised inflows from sales and settlement payouts against outflows from purchases:
Unresolved markets and positions for which no realised outcome can be linked are not included. A wallet is counted as profitable if its realised PnL is greater than zero.
Volume and activity of traders. Group size is measured by the group’s share of all wallets, and market weight by the group’s share of trades and USD volume. Both measures are reported separately, because a group can include many wallets without generating much volume, while a small group can account for a large share of activity.
A wallet-share or volume-share comparison alone does not show which group is most strongly represented inside individual markets. The analysis therefore defines the dominant group in each resolved binary market as the trader group with the largest share of volume in that market. The analysis reports the share of dominated markets, the share of total volume accounted for by those markets, and the median volume share the dominant group holds within its dominated markets. Together, these measures show whether a group dominates many small markets or a few very large markets and how pronounced that dominance is.
To describe when groups trade, each trade is additionally assigned to one of ten lifecycle deciles. The decile is the relative position of the trade timestamp between the creation and the end of its market. For each group, the analysis reports the distribution of trading volume across these deciles.
Market calibration by trader types. The calibration analysis links the price interpretation from Section 2.2 to the trader classification. For each trade or market, the observed price is read as an implied probability and compared with the later realised binary outcome . The main error metric is the Brier Score (Brier, 1950),
It is intuitive, because larger deviations receive a quadratic penalty. Group-level Brier Scores are volume-weighted, so that larger traded positions contribute proportionally more to the group estimate. Log Loss is used as an additional metric,
where extreme forecast errors are penalised particularly strongly. Directional Accuracy is the share of positions for which the implied probability and the realised outcome lie on the same side of the 0.5 threshold. It records whether the direction is correct, not how far the probability lies from the outcome. Both scores mix systematic mispricing with the difficulty of the traded price range.
Following Pakdaman Naeini et al. (2015), the analysis therefore also reports the ECE introduced in Section 2.2. The ECE partitions the positions of a group into price bins (here deciles, ) and aggregates the absolute deviation between the mean implied probability and the realised outcome frequency of each bin, weighted by the share of positions that fall into the bin:
where denotes the total number of positions. In contrast to the Brier Score, the ECE thus isolates systematic over- or underpricing. A low ECE indicates that the prices a group trades at match the realised outcome frequencies on average, irrespective of how difficult the traded price ranges are to predict. Reliability curves visualise the same comparison and show in which price range a group deviates from perfect calibration.
The calibration analysis is conducted at the trader level and evaluates the positions traded by each group. It therefore describes the forecast quality of a group’s own trades and not the quality of the final market prices. A group can appear poorly calibrated on its own positions while being active in markets whose final prices are well calibrated overall.
5. Results
This section applies the classification and analysis framework defined in Section 4 to answer both research questions. For RQ1, it describes the identified trader groups, their market weight, dominance patterns, and realised PnL. For RQ2, it compares the calibration and forecast quality of the positions traded by each group.
5.1 Trader types, activity, and volume (RQ1)
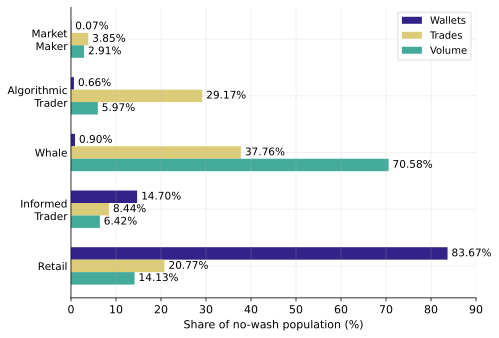
The heuristic introduced in Section 4.4 assigns wallets to five trader types. Retail accounts for 83.67% of wallets, Informed Traders for 14.70%, Whales for 0.90%, Algorithmic Traders for 0.66%, and Market Makers for 0.07%. The groups differ in size, trading intensity, and capital use, so a group’s share of wallets says little about its share of trades or volume.
| Group | Wallets (%) | Trades (%) | Volume (%) | Median trades | Median markets |
|---|---|---|---|---|---|
| Market Maker | 0.07 | 3.85 | 2.91 | 2,364 | 336 |
| Algorithmic Trader | 0.66 | 29.17 | 5.97 | 1,589 | 291 |
| Whale | 0.90 | 37.76 | 70.58 | 2,213 | 139 |
| Informed Trader | 14.70 | 8.44 | 6.42 | 74 | 33 |
| Retail | 83.67 | 20.77 | 14.13 | 30 | 12 |
Table 2 shows that retail forms the broad base of participation with 83.67% of wallets, but trades at small scale and accounts for only 20.77% of all trades. Whales show very high trading activity with a median of 2,213 trades and account for 37.76% of all trades as well as 70.58% of volume, a concentration similar to the findings of Akey et al. (2026). That a group comprising only 0.90% of wallets reaches this share follows from the 99th percentile of trading volume, so a high volume share is expected by definition. With a median of 139 traded markets, whales are also active in a large number of markets. Algorithmic Traders form a small group with 0.66% of wallets, but they account for 29.17% of all trades and, at 5.97%, a volume share that is substantial for their size. Their median of 1,589 trades remains below that of whales. Informed Traders form a comparatively large group with 14.70% of wallets, but they contribute only 8.44% of trades and 6.42% of volume.
With 0.07% of wallets, 3.85% of trades, and 2.91% of volume, Market Makers are barely present. The very low wallet share suggests that independent market making on Polymarket is performed by only a few wallets and that maker-like behaviour otherwise merges into other groups. Figure 2 compares the wallet, trade, and volume shares of all five groups.
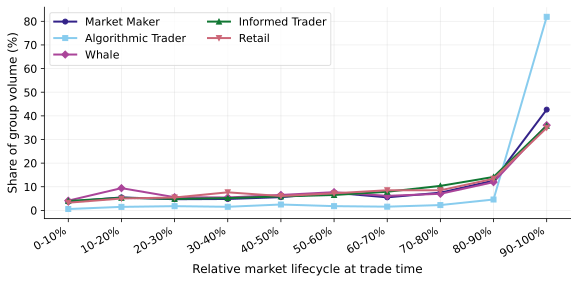
The groups also differ in when they trade within the market lifecycle. Volume rises toward market resolution in every group. Retail, Whale, and Informed Trader wallets place between 34.91% and 36.05% of their volume in the last lifecycle decile, that is, in the final ten percent of the market runtime, and Market Makers reach 42.64% there. Algorithmic Traders concentrate 81.90% of their volume in this final decile (Figure 3). This concentration is partly mechanical, because in short-lived series markets the final decile comprises only seconds to minutes.
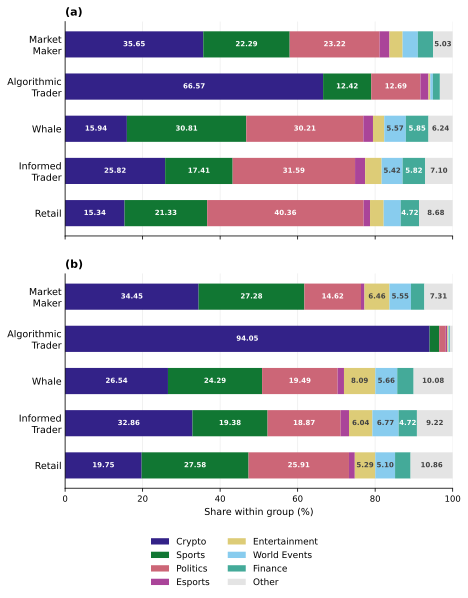
The market categories from Section 4.2 provide additional detail (Figure A3). Algorithmic Traders place 94.05% of their trades and 66.57% of their volume in Crypto, which matches their concentration in the final lifecycle decile. Both patterns point to the short-lived, serially created Crypto series markets. Retail, by contrast, commits its largest volume share to Politics (40.36%), the category with few markets but the highest public relevance, while Whales spread their capital more evenly between Sports (30.81%) and Politics (30.21%). These category patterns are consistent with the trading styles described above. Automated strategies cluster in the serially created market supply, and human traders allocate more volume to publicly relevant questions.
5.2 Market dominance by volume
A market is considered dominated by the group that accounts for the largest USD volume share in that market (Section 4.6). For each resolved binary market, the group volume is summed from the trades. The market is then assigned to the group with the largest volume share.
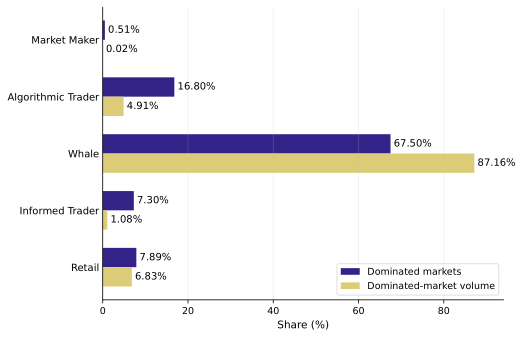
Under this definition, whales dominate the majority of markets. Because whales are defined by the 99th percentile of total trading volume, their frequent dominance is partly a consequence of that definition, especially in markets with low liquidity or individual large positions. Whales dominate 67.50% of markets, which account for 87.16% of the volume of all dominated markets. Algorithmic Traders dominate 16.80% of markets, but only 4.91% of volume, which points to many smaller markets. Informed Trader wallets dominate 7.30% of markets and 1.08% of volume.
| Dominant group | Markets (%) | Volume (%) | Median dominance share (%) |
|---|---|---|---|
| Market Maker | 0.51 | 0.02 | 91.27 |
| Algorithmic Trader | 16.80 | 4.91 | 68.51 |
| Whale | 67.50 | 87.16 | 80.01 |
| Informed Trader | 7.30 | 1.08 | 65.34 |
| Retail | 7.89 | 6.83 | 54.05 |
Table 3 further reports the median volume share held by the leading group. In Whale-led markets, Whales account for a median 80.01% of traded volume. The corresponding shares in markets led by Algorithmic Traders and Informed Trader wallets are 68.51% and 65.34%, respectively, both well above a narrow relative majority. The leading group therefore holds a clear majority of traded volume in most cases. Figure 4 juxtaposes each group’s share of markets with its share of volume.
5.3 Profitability and redistribution
While volume is concentrated among whales, realised PnL shows which groups win at the expense of which other groups. Table 4 reports the share of profitable wallets as well as the mean, median, standard deviation, aggregate PnL, and PnL per USD 1,000 of trading volume for each group.
| Group | Profitable (%) | Mean PnL (USD) | Median PnL (USD) | Std. (USD) | Total PnL (m USD) | PnL / USD 1k vol. |
|---|---|---|---|---|---|---|
| Market Maker | 64.37 | 1,756.16 | 110.53 | 26,908.20 | 1.22 | 1.79 |
| Algorithmic Trader | 33.02 | 1,023.46 | −59.46 | 52,088.61 | 6.97 | 4.98 |
| Whale | 48.10 | 10,307.04 | −205.06 | 424,176.46 | 95.81 | 5.79 |
| Informed Trader | 55.51 | 171.22 | 0.79 | 4,415.08 | 26.06 | 17.31 |
| Retail | 28.80 | −118.60 | −2.64 | 2,424.79 | −101.48 | −30.61 |
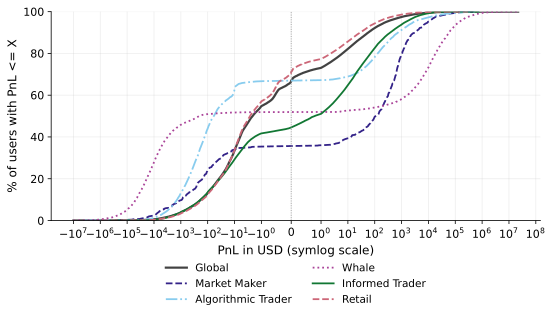
Mean and median diverge widely in all groups. Whales achieve the largest aggregate gain at USD 95.81 million and the highest mean at USD 10,307.04, but their median is USD −205.06. The top decile of whales gains at least USD 58,706, and the bottom decile loses more than USD 47,834. The positive total value of the group is carried by a small upper tail, while the typical whale wallet loses money. The same pattern appears in weaker form among Algorithmic Traders, who gain USD 6.97 million in aggregate, but lose USD 59.46 at the median and are profitable in only 33.02% of cases. Even where the median is positive, it remains far below the mean, at USD 110.53 for Market Makers and USD 0.79 for Informed Traders, although these two groups show the highest shares of profitable wallets at 64.37% and 55.51%. In each group, gains arise mainly in the upper tail of the PnL distribution. The standard deviation of PnL points in the same direction, since it exceeds the mean in every group by a multiple. Dispersion is largest among whales at USD 424,176.46, followed by Algorithmic Traders (USD 52,088.61) and Market Makers (USD 26,908.20). Even for retail, the standard deviation of USD 2,424.79 is far above the magnitudes of the mean and median. The groups differ in central tendency and, even more strongly, in the dispersion of their PnL distributions, which limits the informational value of simple mean comparisons. Retail is the only group with a negative aggregate result, and only 28.80% of retail wallets are profitable. The 75th percentile of retail PnL is only USD 0.38, so at least three quarters of these wallets achieve only a near-zero result or a loss. Across the sample, 33.00% of all wallets are profitable.
Because Polymarket is a zero-sum game, aggregate PnL measures redistribution between participants (Section 4.3). The retail group’s losses of USD 101.48 million stand against gains of the remaining classified groups totalling USD 130.06 million. The remaining difference is attributable to the wallets excluded from the classification, in particular short-lived accounts and wash-flagged wallets. On the winning side, the largest aggregate gains accrue to Whales (USD 95.81 million) and Informed Traders (USD 26.06 million). Because counterparties of individual trades are not observed here, this redistribution statement applies at the aggregate level and not to individual trading relationships. Relative to capital deployed, whales combine the largest total PnL at USD 95.81 million with only USD 5.79 per USD 1,000 of volume, whereas Informed Trader wallets earn less in total at USD 26.06 million but much more per dollar traded. The whale result is mainly a capital-use effect, while the Informed Trader result reflects a higher normalised gain.
The cumulative distribution in Figure 5 shows the same skewness at the wallet level. The symmetrically logarithmic x-axis makes both small gains and losses and extreme outliers visible. The curves show the left-skewed retail distribution and the broad Whale distribution particularly clearly.
Answer to RQ1
The heuristic identifies Retail, Informed Traders, Whales, Algorithmic Traders, and Market Makers as five trader types on Polymarket. Retail accounts for 83.67% of wallets, followed by Informed Traders at 14.70%. Each of the other three groups represents less than 1% of wallets. Trading activity and volume are far more concentrated than these wallet shares suggest. Whales comprise 0.90% of wallets and account for 37.76% of trades and 70.58% of volume. Algorithmic Traders comprise 0.66% of wallets but generate 29.17% of trades. Retail accounts for 20.77% of trades and 14.13% of volume and loses USD 101.48 million in aggregate. Whales gain USD 95.81 million in aggregate, although the median Whale wallet loses money. Market Makers and Informed Traders are the only groups in which a majority of wallets are profitable.
5.4 Calibration and forecast quality (RQ2)
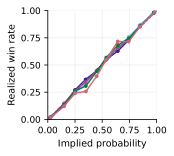
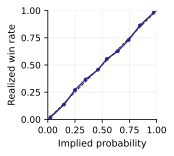
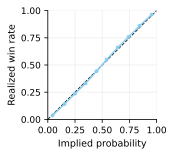
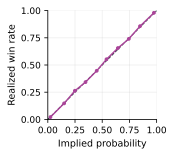
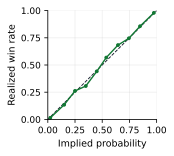
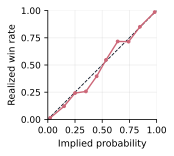
The calibration analysis tests whether the implied probabilities traded by a group correspond to the later realised outcomes. Good calibration is present when the observed occurrence frequencies lie close to the diagonal in Figure 6, meaning, for example, that events with an implied probability of 70% also occur in about 70% of cases. Table 5 reports the volume-weighted Brier Score, Log Loss, Directional Accuracy, and ECE for each trader group.
| Group | Brier Score (weighted) | Log Loss | Directional Accuracy (%) | ECE |
|---|---|---|---|---|
| Market Maker | 0.102 | 0.371 | 80.59 | 0.010 |
| Algorithmic Trader | 0.152 | 0.521 | 72.66 | 0.012 |
| Whale | 0.123 | 0.363 | 81.86 | 0.006 |
| Informed Trader | 0.086 | 0.321 | 84.76 | 0.012 |
| Retail | 0.102 | 0.329 | 84.01 | 0.024 |
The Brier Score describes calibration incompletely, because it combines systematic mispricing with the difficulty of the traded price ranges (Section 4.6). The ECE isolates systematic deviation, because it measures the average difference between predicted probabilities and realised event frequencies instead of the forecast quality of single trades (Pakdaman Naeini et al., 2015). According to ECE, Whales (0.006), the Market Maker group (0.010), the Algorithmic Trader group (0.012), and Informed Traders (0.012) trade with a small bias. Retail users have the highest ECE at 0.024, although their Brier Score (0.102) is only slightly above that of the Informed Trader group (0.086) and below that of Whales (0.123).
Figure 6 shows the direction of this bias, first overlaid for all groups (a) and then separately for each group (b–f). In the range of implied probabilities between about 0.3 and 0.5, the realised winning rate of Retail positions lies clearly below the diagonal (f), meaning the contract prices lie above the fair contract values. In the price decile around 0.35, retail positions win in only 25.7% of cases. For Market Makers, volume additionally concentrates at the price edges, so the group’s volume-weighted Brier Score remains low at 0.102.
(a) All groups
(b) Market Maker
(c) Algorithmic Trader
(d) Whale
(e) Informed Trader
(f) Retail
For Directional Accuracy, Informed Traders (84.76%) and Retail (84.01%) lead, while Algorithmic Traders reach only 72.66%. A group can often be on the correct side and still be less well calibrated if its traded probabilities deviate more strongly from the realised frequencies. The Algorithmic Trader group thus combines positive aggregate gains (Table 4) with the lowest hit rate and the highest Brier Score of all groups.
Answer to RQ2
Forecast quality differs clearly across the five trader groups. Informed Traders perform best overall, with the lowest Brier Score (0.086) and Log Loss (0.321) and the highest Directional Accuracy (84.76%). Retail positions remain close on these measures. Their ECE of 0.024 is the highest among all groups and reflects systematically overpriced contracts at implied probabilities between approximately 0.3 and 0.5. Whales have the lowest ECE at 0.006, and Market Makers also show little systematic deviation with an ECE of 0.010. Neither group matches the overall forecast quality of Informed Traders. Algorithmic Traders rank last on all three forecast-quality measures. Their Brier Score is 0.152, their Log Loss is 0.521, and their Directional Accuracy is 72.66%, although their ECE remains low at 0.012. Systematic calibration error and overall forecast quality therefore capture different aspects of performance. Market weight is not a reliable indicator of forecast quality.
6. Discussion
The results show concentrated gains, broad retail losses, and different calibration profiles across trader groups. The discussion interprets these patterns for the informational value of Polymarket, for users and platform design, and for regulation.
6.1 Interpretation of results
The profitability results indicate a redistribution of realised PnL across trader groups. As shown in Section 5.3, Retail wallets lose USD 101.48 million in aggregate, while all other observed groups record positive aggregate PnL. In a zero-sum market, these losses imply corresponding gains among the other observed trader groups. This extends the maker–taker wealth transfer documented by Becker (2026), who finds a systematic transfer from takers to makers on Kalshi, with market makers as the most profitable group. The present results suggest that a similar redistribution appears at the trader-group level on Polymarket, where retail losses correspond to the aggregate gains of the smaller groups.
The retail group has the highest ECE (0.024) as well as the largest monetary loss. The reliability curves also show a favourite–longshot bias in the retail positions, whose low-priced contracts are systematically overpriced (Section 2.2, Section 5.4). This finding does not contradict Reichenbach and Walther (2025), who find no market-wide favourite–longshot bias on Polymarket, because the bias observed here emerges only at the level of a single trader group. Becker (2026) documents a comparable grouping pattern for Kalshi. With regard to forecast quality, by contrast, the Brier Score of 0.102 is very close to that of the Informed Trader group (0.086). Part of the forecast accuracy of Informed Traders is already built into the heuristic definition, because the group is defined, among other criteria, by a win rate of at least 55% (Section 4.4). Retail, by contrast, is the residual category and is not subject to an accuracy filter.
The most plausible explanation for this combination of broad individual losses and comparatively accurate traded positions is the wisdom of the crowds (Surowiecki, 2004). When many independent judgements are combined, individual errors can offset one another, so aggregate prices can be accurate (Surowiecki, 2004). Good forecast quality and broad individual losses can coexist on Polymarket (Akey et al., 2026).
Although whales who stake very high amounts on a single outcome might be expected to do so only after careful evaluation and on the basis of especially good information, the data do not support this expectation. Whales show a higher aggregate forecast error than retail traders (Brier Score 0.123). The high aggregate whale PnL does not mean that whales are predominantly successful traders. Only 48.10% of them are profitable, and the median PnL is USD −205.06. The positive total gain of the group arises from a small upper tail with very high gains, while the majority of whales realise losses (Table 4).
One explanation is that the whale group also contains some “YOLO trades” (you only live once), that is, especially risky and large individual positions entered into because of speculative risk tolerance and the prospect of a large possible gain. If cryptocurrency users are financially well-equipped young men (Steinmetz et al., 2021), this fits sociologically with their willingness to take risks (Dohmen et al., 2011). Accordingly, large positions do not necessarily indicate an informational advantage, but can also reflect high risk tolerance and speculation.
A second explanation is that some large positions are hedges rather than forecasts. Tsang and Yang (2026) find trading patterns on Polymarket that correspond to hedging strategies. Hedging means taking an offsetting position whose payoff develops in the opposite direction of an existing risk, so that losses in one position are compensated by gains in another position (Hull, 2021). For example, a company that expects worse business conditions under a Republican election outcome can buy Republican contracts, so that the payout cushions the loss if Republicans win the election. Unlike the Iowa Electronic Markets, which capped stakes at small amounts, Polymarket is suitable for hedging because of its design (Wolfers & Zitzewitz, 2004). For a hedger, a negative expected value of the position can be rational, because it represents the price of reducing total risk, similar to an insurance premium (Hull, 2021). Whale positions would then reflect a risk transfer.
For the Algorithmic Trader group, profitability and calibration together produce a consistent picture. The group generates positive aggregate gains despite the lowest directional accuracy and the highest Brier Score (Section 5.4), and it concentrates its volume shortly before market resolution (Section 5.1). This suggests that its gains stem more from execution and arbitrage than from superior forecasting, consistent with automated strategies that react to new information and price inconsistencies shortly before markets resolve. Conversely, the calibration advantage of the Market Maker and Informed Trader groups does not prove that every wallet in these groups has private information.
Finally, the near-absence of independent Market Makers (Section 5.1) could stem from Polymarket’s extended exclusion from the U.S. market, which may have kept professional liquidity providers away from the platform (Cutting et al., 2025).
6.2 Implications for the informational value of prediction markets
The results caution against equating market participation with information provision. The groups that dominate volume (Section 5.1) are not the groups with the most accurate forecasts, and the numerically dominant retail group is individually miscalibrated but collectively close to the realised outcome frequencies, a coexistence that Akey et al. (2026) also document. Prices on prediction markets need not reflect the superior information of every participant. Their informational value arises from the aggregation of dispersed beliefs, through which individual errors can offset one another, and from informed or selectively active traders who have incentives to correct mispricings when deviations become profitable (Wolfers & Zitzewitz, 2004).
6.3 Relevance for stakeholders
The results show that assessing Polymarket prices requires examining the traders who produce them. What follows from this differs between researchers, users, the platform, and regulators.
For researchers, the results offer a more detailed picture of market structure. Prediction markets are often evaluated as a whole, for example by testing whether their prices are more informative than alternative forecasting methods. Such aggregate comparisons leave the internal composition of the market invisible. A classification instead treats users as distinct groups whose participation conditions can be examined separately, which makes the microstructure of Polymarket accessible to further analysis.
For Polymarket users, the results are relevant because the platform is a zero-sum market in which the realised profit of one trader is matched by realised losses elsewhere (Section 2.3). Retail traders in particular, as the biggest group with 83.67% of wallets, need to be aware of whom they are competing against. Only 28.80% of retail wallets are profitable, while the overall distribution of profits and losses indicates a systematic money transfer from less skilled or less informed participants to traders with better information or better strategies (Becker, 2026). For the majority of its users, Polymarket is thus an unprofitable environment despite the informative prices it produces.
For Polymarket as a platform, the results are relevant because they show how different groups contribute to market activity and market quality. Monitoring traders can help the platform identify suspicious behaviour, understand where traders come from, and design incentives that improve the quality of its markets.
For regulators, the results show that prediction markets are platforms where the majority of participants lose money systematically. The large negative PnL of retail traders suggests that consumer protection should be part of the discussion, especially if prediction markets become more mainstream and gamified. Pseudonymity also makes it difficult to see who moves large amounts of money and to combat coordinated manipulation or fraud. Therefore, regulation should consider market integrity and the protection of inexperienced users, rather than banning prediction markets, since they can produce informative forecasts on relevant questions.
6.4 Limitations
The limitations concern the validity of the constructed trader types, the validity of the measurements on which the classification is based, and the generalisability of the findings.
Construct validity of the trader types. The central limitation lies in the trader classification itself. The trader types should be understood as heuristic groups detached from traders’ actual identities. This classification makes pseudonymous wallet data comparable, but it cannot guarantee that every real trader fits fully and unambiguously into one group. Trading behaviour represents only a proxy for the background of the individual user. Users can trade for diverse motives (Hull, 2021) that are not directly observable in the transaction data and that can overlap within the same wallet. For example, a wallet classified as retail can still trade with an informational advantage in individual markets. The heuristic assigns each wallet to the group that best fits its dominant observed pattern rather than capturing the motive behind each individual trade.
A more specific classification problem concerns algorithmic roles. Algorithmic Traders, arbitrageurs, and Market Makers can look similar in transaction data, because all three can trade frequently, hold positions briefly, and rely on automated execution. Because the data do not directly reveal the strategy, this separation remains approximate.
The same caution applies to the rules used to define the groups. They are derived from existing literature on prediction markets, market microstructure, and electronic trading (Rothschild & Sethi, 2015; Kirilenko et al., 2017; Becker, 2026). These studies provide a useful theoretical foundation for the selected features, but they examine markets that differ from Polymarket in design, regulation, trader access, and data availability. For this reason, the thresholds and priority rules should be understood as transparent modelling decisions whose boundaries are set analytically. Other cutoffs or a different priority order could shift individual wallets at the margins, especially where high volume, high trading frequency, and profitable behaviour coincide. The sensitivity analysis in Section 4.5 shows, however, that such shifts at the margins do not change the direction of the main results.
Internal validity of the measurements. A further limitation concerns the measurements themselves, in particular the exclusion of wash traders. Wash trading must be considered, because artificial volume would distort the activity and volume measures on which the classification is based. The filter based on Sirolly et al. (2026) reduces this problem but cannot remove it completely. Some artificial activity can remain in the sample, and legitimate users can be excluded if their trading patterns resemble suspicious clusters.
The use of a wallet’s median holding period limits the influence of a few unusually long positions. Using another robust summary, such as a trimmed mean, could nevertheless move wallets close to the ten-minute threshold into or out of the Algorithmic Trader group.
Categorical markets and broader event groupings can contain several linked or thematically related outcomes, so the probability and payoff structure is less directly comparable across markets. Excluding them improves measurement consistency, but it also means that the results do not cover the full range of Polymarket market designs.
External validity. Because Polymarket requires knowledge of cryptocurrencies, the user base is reduced to a niche (Steinmetz et al., 2021). In addition, Polymarket was officially inaccessible to users from the United States during the study period (Cutting et al., 2025) and still excludes numerous European states, including Germany, from order placement (Polymarket, n.d.). The observed results are subject to strong access restrictions, and it remains open whether the same heuristic would classify wallets identically if the user base grew through broader regulatory access.
These limitations mean that the results can be seen as a comparative analysis of observable trading patterns of wallets. Within this scope, the heuristic remains useful, because direct identification is impossible under Polymarket’s pseudonymity and a transparent classification is what makes the market structure empirically analysable at all.
7. Conclusion and outlook
Polymarket can produce informative prices even though most retail wallets lose money and gains concentrate in a small upper tail. This section summarises that finding and outlines three directions for future research.
7.1 Summary of key findings
With regard to RQ1, the results show that Polymarket’s market structure is shaped by a strong separation between participation breadth and market weight. Retail wallets form the broad base of the platform and lose money in aggregate, but their traded positions still contribute to comparatively accurate forecasts. The wisdom of the crowds can work at the level of aggregate price formation even when many individual members of that crowd trade unprofitably.
With regard to RQ2, this accuracy has limits. The reliability curves in Figure 6 (f) show a favourite–longshot bias for retail wallets, whose low-priced contracts trade systematically overpriced. Realised gains nevertheless concentrate in a small group of highly profitable wallets. The Informed Trader group provides the best forecast quality, while Algorithmic Traders appear more closely tied to execution and arbitrage than to superior prediction. Polymarket’s informational value rests on both the breadth of the retail crowd and the activity of smaller, better-capitalised, and more selective groups.
7.2 Future research directions
The behavioural classification developed here leaves open how closely the observed wallet groups correspond to individual traders and motives. Future research could combine transaction records with voluntary wallet verification, interviews, or surveys to distinguish professional trading, speculation, and information-based participation. Entity-level wallet clustering and time-varying classifications could further test whether traders operate through several addresses or move between roles across markets and over time. Such research would extend the analysis from observable wallet behaviour toward the actors and motives behind that behaviour.
A second research direction concerns the mechanisms that produce the observed differences in profitability. Retail wallets trade comparatively accurate positions but incur large aggregate losses, while the positive aggregate profit of Whales is concentrated in a small upper tail. Future studies could decompose these outcomes into forecast selection, execution timing, spread capture, price impact, and position sizing. Analyses could also examine whether traders learn from losses, specialise in particular market categories, or leave the platform after unsuccessful trading.
Future research should also examine how trader heterogeneity affects price formation. Group-specific order flow and subsequent price changes could reveal which traders incorporate new information, which provide liquidity, and which create temporary price pressure. Counterfactual calibration analyses could test whether Polymarket would remain informative without the trades of particular groups. Related work could investigate how news events, coordinated trading, platform rules, and regulatory access change the balance between information aggregation, profit concentration, and retail losses.
Together, these directions would move the study of prediction-market participants from classifying who trades to explaining why they trade, how their roles change, and how their interaction produces informative prices.
Appendix
A.1 Account lifetime distribution
A.2 Robustness check overview
A.3 Trader-group activity by market category
References
All links were last followed on 12 July 2026.
- Akey, P., Grégoire, V., Harvie, N., & Martineau, C. (2026). Who Wins and Who Loses in Prediction Markets? Evidence from Polymarket. SSRN Working Paper.
- Arrow, K. J., Forsythe, R., Gorham, M., Hahn, R., Hanson, R., Ledyard, J. O., Levmore, S., Litan, R., Milgrom, P., Nelson, F. D., Neumann, G. R., Ottaviani, M., Schelling, T. C., Shiller, R. J., Smith, V. L., Snowberg, E., Sunstein, C. R., Tetlock, P. C., Tetlock, P. E., Varian, H. R., Wolfers, J., & Zitzewitz, E. (2008). The Promise of Prediction Markets. Science, 320(5878), 877–878.
- Auer, R., & Tercero-Lucas, D. (2022). Distrust or speculation? The socioeconomic drivers of U.S. cryptocurrency investments. Journal of Financial Stability, 62, 101066.
- Becker, J. (2026). The Microstructure of Wealth Transfer in Prediction Markets. jbecker.dev.
- Berg, J. E., Nelson, F. D., & Rietz, T. A. (2008). Prediction Market Accuracy in the Long Run. International Journal of Forecasting, 24(2), 285–300.
- Brier, G. W. (1950). Verification of Forecasts Expressed in Terms of Probability. Monthly Weather Review, 78(1), 1–3.
- Cutting, L. E., Hughes-Berheim, S. S., Johnson, P. M., Baroud, H., & Goldstein, B. (2025). Are Betting Markets Better than Polling in Predicting Political Elections? arXiv:2507.08921.
- Dawid, A. P. (1982). The Well-Calibrated Bayesian. Journal of the American Statistical Association, 77(379), 605–610.
- Dohmen, T., Falk, A., Huffman, D., Sunde, U., Schupp, J., & Wagner, G. G. (2011). Individual Risk Attitudes: Measurement, Determinants, and Behavioral Consequences. Journal of the European Economic Association, 9(3), 522–550.
- Ethereum.org (2026). ERC-1155 Multi-Token Standard.
- Fama, E. F. (1970). Efficient Capital Markets: A Review of Theory and Empirical Work. The Journal of Finance, 25(2), 383.
- Griffith, R. M. (1949). Odds Adjustment by American Horse Race Bettors. American Journal of Psychology, 62(2), 290–294.
- Hanson, R. (2006). Decision Markets for Policy Advice. In A. S. Gerber & E. M. Patashnik (Eds.), Promoting the General Welfare: New Perspectives on Government Performance (pp. 151–173). Brookings Institution Press.
- Hull, J. C. (2021). Options, Futures, and Other Derivatives (11th ed.). Pearson.
- Kalshi (2025). Kalshi to Become CNN’s Official Prediction Market Partner. Kalshi News.
- Kirilenko, A., Kyle, A. S., Samadi, M., & Tuzun, T. (2017). The Flash Crash: High-Frequency Trading in an Electronic Market. The Journal of Finance, 72(3), 967–998.
- Lyons, R. K., & Viswanath-Natraj, G. (2019). What Keeps Stable Coins Stable? SSRN Electronic Journal.
- Murphy, A. H., & Winkler, R. L. (1987). A General Framework for Forecast Verification. Monthly Weather Review, 115(7), 1330–1338.
- Pakdaman Naeini, M., Cooper, G. F., & Hauskrecht, M. (2015). Obtaining Well Calibrated Probabilities Using Bayesian Binning. Proceedings of the Twenty-Ninth AAAI Conference on Artificial Intelligence, 2901–2907.
- Ottaviani, M., & Sørensen, P. N. (2008). The Favorite-Longshot Bias: An Overview of the Main Explanations. In Handbook of Sports and Lottery Markets (pp. 83–101). Elsevier.
- Polymarket (2026a). How are Markets Created? Polymarket Help Center.
- Polymarket (n.d.). Geographic Restrictions. Polymarket Documentation.
- Rahman, N., Al-Chami, J., & Clark, J. (2026). SoK: Market Microstructure for Decentralized Prediction Markets (DePMs). arXiv:2510.15612v3.
- Reichenbach, F., & Walther, M. (2025). Exploring Decentralized Prediction Markets: Accuracy, Skill, and Bias on Polymarket. SSRN Working Paper.
- Rothschild, D. M., & Sethi, R. (2015). Trading Strategies and Market Microstructure: Evidence from a Prediction Market. SSRN Working Paper.
- Saguillo, O., Ghafouri, V., Kiffer, L., & Suarez-Tangil, G. (2025). Unravelling the Probabilistic Forest: Arbitrage in Prediction Markets. arXiv.
- Sirolly, A., Ma, H., Kanoria, Y., & Sethi, R. (2026). Network-Based Detection of Wash Trading. SSRN Working Paper.
- Steinmetz, F., von Meduna, M., Ante, L., & Fiedler, I. (2021). Ownership, uses and perceptions of cryptocurrency: Results from a population survey. Technological Forecasting and Social Change, 173, 121073.
- Surowiecki, J. (2004). The Wisdom of Crowds: Why the Many Are Smarter Than the Few and How Collective Wisdom Shapes Business, Economies, Societies and Nations. Doubleday.
- Swift (n.d.). The KYC Process Explained.
- Tsang, K. P., & Yang, Z. (2026). The Anatomy of Polymarket: Evidence from the 2024 Presidential Election. arXiv:2603.03136.
- Verdecchia, R., & Bogner, J. (2025). Notes On Writing Effective Empirical Software Engineering Papers: An Opinionated Primer. ACM SIGSOFT Software Engineering Notes, 50(3), 24–36.
- Wang, Z., Chao, L., Bao, Y., Cheng, L., Liao, J., & Li, Y. (2026). Polymarket Data: Complete Data Infrastructure for Polymarket. Hugging Face.
- Wolfers, J., & Zitzewitz, E. (2004). Prediction Markets. Journal of Economic Perspectives, 18(2), 107–126.

