
Abstract
Prediction markets allow participants to trade contracts whose payoff depends on a future event. Their prices can therefore be read as market-implied probabilities. Polymarket makes the resulting transactions unusually transparent, while the people behind its wallet addresses remain pseudonymous.
This study asks who trades on Polymarket and how observable trader types differ. It analyzes the public dataset by Wang et al. (2026), covering October 2, 2020 through January 17, 2026. A deterministic behavioral heuristic classifies 1,035,224 wallets from 261,649,128 trades with a combined volume of $26.86 billion.
Retail is the crowd, but not the capital. Retail accounts for 83.67% of wallets, 20.77% of trades, and 14.13% of volume.
Whales carry most of the market weight. Only 0.90% of wallets generate 70.58% of trading volume.
Accurate positions do not guarantee profits. Retail positions score close to those of Informed Traders, yet Retail loses $101.48 million in aggregate.
The central finding is not simply that some groups win and others lose. It is that Polymarket’s informational value coexists with pronounced differences in capital, profitability, and trading behavior. Accurate aggregate forecasts and heterogeneous individual outcomes can be present at the same time.
The research question
Prediction-market prices are commonly interpreted as aggregated probability estimates (Wolfers & Zitzewitz, 2004). That interpretation is incomplete if the traders producing those prices are treated as one homogeneous crowd. A price formed by many independent, lightly capitalized participants means something different from a price dominated by a small number of high-volume wallets.
Polymarket exposes transactions, positions, and outcomes at wallet level, but does not reveal the identities, information, or motives behind those wallets. The analysis therefore does not attempt to identify real people or institutions. It compares observable behavioral patterns.
Which trader types can be identified from observable wallet behavior, and how do they differ in size, activity, volume, and profitability?
How do these trader types differ in the calibration and forecast quality of the positions they trade?
How prediction markets turn prices into probabilities
In a binary event contract, one share pays one unit if the event occurs and zero otherwise. A transaction price of 0.70 can therefore be read as a market-implied probability of 70%. Mispricing creates a profit opportunity for traders whose private estimate differs from the market price, which can move the price toward a better aggregate estimate (Wolfers & Zitzewitz, 2004) (Arrow et al., 2008).
This mechanism does not require every trader to be informed or profitable. Independent errors can offset one another, while better-informed marginal trades correct prices. This is the core of the “wisdom of crowds” interpretation (Surowiecki, 2004).
Polymarket combines an off-chain central limit order book with blockchain settlement on Polygon. During the observation period, positions were collateralized in USDC, and complementary YES/NO shares were designed to sum to one apart from market frictions (Rahman et al., 2026) (Saguillo et al., 2025). For resolved contracts, realized profit and loss is zero-sum across participants: one trader’s gain is matched by losses elsewhere.
Data and method
The source dataset contains 293,333,497 trades and 1,767,516 wallets (Wang et al., 2026). Basic cleaning removes malformed records. The market sample is then restricted to resolved binary contracts, because profitability and calibration require a known outcome. The wallet sample excludes accounts with fewer than seven days between first and last observed trade and wallets dominated by wash-flagged activity.
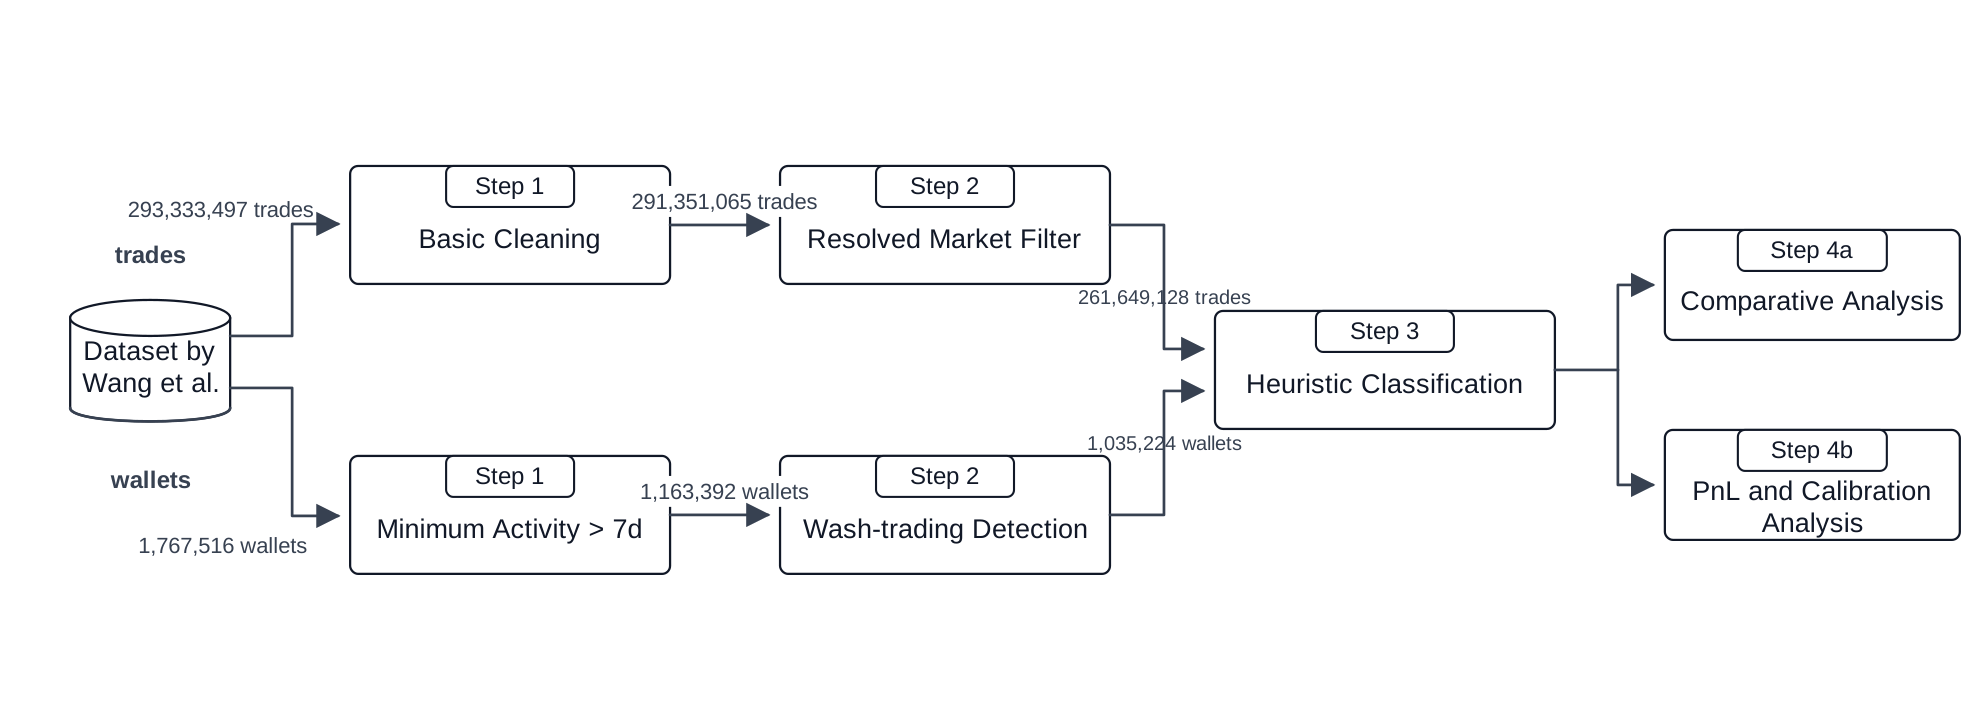
Each retained wallet is described by account lifetime, number of trades and markets, total volume, maker ratio, median holding period, win rate, and realized profit and loss. These features support a fixed-priority classification inspired by behavioral market-microstructure research (Rothschild & Sethi, 2015) (Kirilenko et al., 2017).
| Group | Observable rule | Interpretation |
|---|---|---|
| Market Maker | Maker ratio > 0.96, trade count above the 97th percentile, at least 20 markets | Exceptional activity dominated by liquidity provision |
| Algorithmic Trader | Trade count above the 97th percentile, median holding time under 10 minutes, maker ratio ≤ 0.96 | High-frequency, short-horizon pattern |
| Whale | Total volume above the 99th percentile, maker ratio ≤ 0.96 | Capital-intensive trading |
| Informed Trader | Win rate ≥ 55%, trade count at or above the median | Repeated above-average realized success |
| Retail | No earlier rule applies | Residual broad-participation group |
Wash-trading detection follows the network-based approach of Sirolly et al. (2026). A wallet is excluded when wash-flagged trades account for at least half of its observed volume. Sensitivity checks vary the thresholds separately. The central direction of the results remains stable around the selected values; the strongest sensitivity appears when the Whale cutoff is narrowed from the top 1% to the top 0.5%.
Participation breadth and market weight diverge
Retail represents the overwhelming majority of wallets, but Whales and Algorithmic Traders account for most activity and capital. Whales alone generate 37.76% of trades and 70.58% of volume. Algorithmic Traders represent 0.66% of wallets but 29.17% of trades.
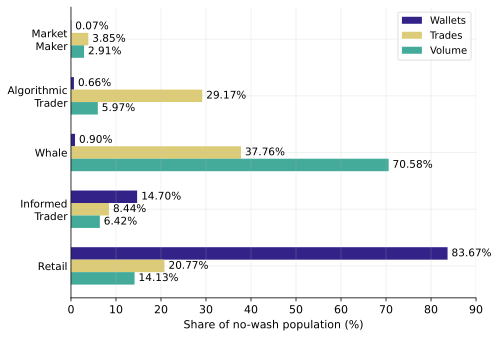
| Group | Wallets | Trades | Volume | Median trades | Median markets |
|---|---|---|---|---|---|
| Market Maker | 0.07% | 3.85% | 2.91% | 2,364 | 336 |
| Algorithmic | 0.66% | 29.17% | 5.97% | 1,589 | 291 |
| Whale | 0.90% | 37.76% | 70.58% | 2,213 | 139 |
| Informed | 14.70% | 8.44% | 6.42% | 74 | 33 |
| Retail | 83.67% | 20.77% | 14.13% | 30 | 12 |
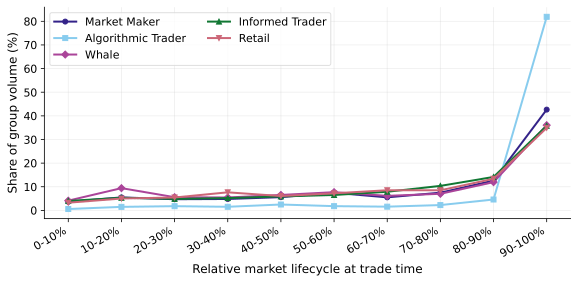
Trading volume rises toward resolution for every group. Algorithmic Traders are the outlier: 81.90% of their volume falls into the final tenth of a market’s lifetime. Their activity is also concentrated in short-lived, serially created crypto markets.
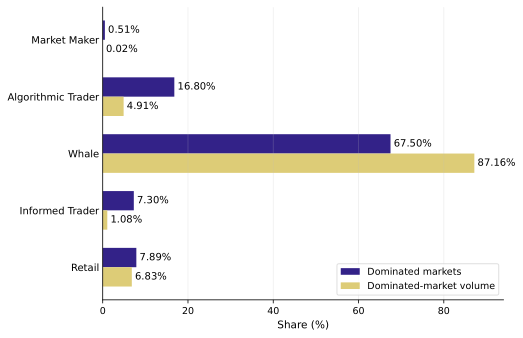
Whales dominate 67.50% of resolved markets under a volume-based definition. Those markets represent 87.16% of all volume in dominated markets. Algorithmic Traders dominate 16.80% of markets, but those markets account for only 4.91% of volume, pointing to a large number of smaller markets.
Profits are concentrated in a narrow upper tail
Retail is the only group with a negative aggregate result. It loses $101.48 million, and only 28.80% of Retail wallets are profitable. Whales gain $95.81 million in aggregate, but the median Whale loses $205.06. The group’s positive total is carried by a small upper tail of very large winners.
| Group | Profitable | Mean PnL | Median PnL | Total PnL | PnL / $1k volume |
|---|---|---|---|---|---|
| Market Maker | 64.37% | $1,756.16 | $110.53 | $1.22m | $1.79 |
| Algorithmic | 33.02% | $1,023.46 | −$59.46 | $6.97m | $4.98 |
| Whale | 48.10% | $10,307.04 | −$205.06 | $95.81m | $5.79 |
| Informed | 55.51% | $171.22 | $0.79 | $26.06m | $17.31 |
| Retail | 28.80% | −$118.60 | −$2.64 | −$101.48m | −$30.61 |
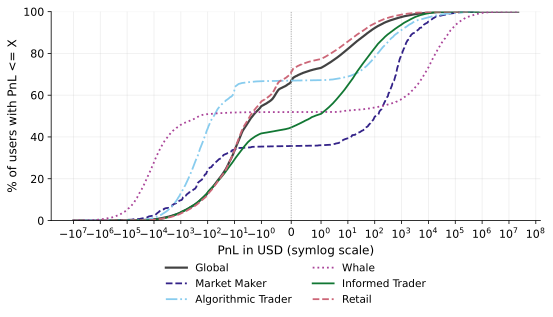
Market Makers and Informed Traders are the only groups in which a majority of wallets is profitable. Normalized by volume, Informed Traders earn the most at $17.31 per $1,000 traded. The Whale result is primarily a capital-use effect; the Informed result reflects a higher return per dollar deployed.
Forecast quality is not the same as market weight
Forecast quality is evaluated from the prices traded by each group and the eventual binary outcome. The Brier Score penalizes squared probability error (Brier, 1950). Log Loss penalizes confidently wrong forecasts particularly strongly. Directional Accuracy asks whether the traded probability and outcome fall on the same side of 0.5. Expected Calibration Error (ECE) measures the average difference between binned prices and realized frequencies (Naeini et al., 2015).
| Group | Brier | Log Loss | Directional accuracy | ECE |
|---|---|---|---|---|
| Market Maker | 0.102 | 0.371 | 80.59% | 0.010 |
| Algorithmic | 0.152 | 0.521 | 72.66% | 0.012 |
| Whale | 0.123 | 0.363 | 81.86% | 0.006 |
| Informed | 0.086 | 0.321 | 84.76% | 0.012 |
| Retail | 0.102 | 0.329 | 84.01% | 0.024 |
Informed Traders perform best overall. Retail positions remain close on Brier Score, Log Loss, and Directional Accuracy, but Retail has the largest systematic calibration error. Around an implied probability of 0.35, Retail positions win in only 25.7% of cases. This is consistent with a favorite–longshot bias within the Retail group: low-probability contracts are systematically overpriced.
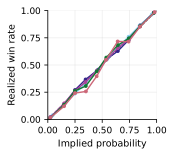
Whales show the lowest ECE, yet their Brier Score is worse than Retail’s. Algorithmic Traders have positive aggregate profit despite the weakest forecast metrics. Calibration, overall forecast accuracy, execution quality, and profitability therefore describe different dimensions of performance.
What the results mean
Accurate markets can contain many losing traders
Retail wallets lose broadly, but the probabilities they trade remain comparatively accurate. This is consistent with previous evidence that well-calibrated aggregate prices can coexist with losses for most individual participants (Reichenbach & Walther, 2025) (Akey et al., 2026). The crowd can contribute information even when many members of that crowd fail to capture profit.
Large positions do not prove superior information
Whales dominate capital but not forecast quality. Their negative median and broad outcome distribution suggest that high volume can reflect risk tolerance, speculation, or hedging as well as informational advantage. Hedging positions may be rational even when their isolated expected return is negative, because they offset risk elsewhere (Hull, 2021). Polymarket research has documented patterns consistent with hedging strategies (Tsang & Yang, 2026).
Algorithmic profit appears closer to execution than prediction
Algorithmic Traders concentrate volume shortly before resolution and earn a positive aggregate result while ranking last on the three broad forecast-quality metrics. The pattern is consistent with strategies focused on arbitrage, reaction speed, and execution rather than superior long-horizon forecasting.
Bottom line: market weight is not a reliable indicator of forecast quality. Polymarket’s information comes from the interaction of a broad crowd with smaller, better-capitalized, and more selective groups—not from one uniformly informed participant base.
Limitations and next questions
The trader types are heuristic labels, not verified identities. One person may control several wallets, a wallet may change roles over time, and motives such as speculation, information, liquidity provision, or hedging can overlap. The priority rules assign each wallet to the dominant observable pattern and cannot explain every individual trade.
The wash-trading filter reduces artificial activity but cannot remove it perfectly. Median holding time and percentile thresholds are transparent modeling choices; wallets close to a boundary can change group under an alternative specification. The sensitivity checks support the main direction of the findings, but not a claim that every individual wallet is classified correctly.
The analysis is restricted to resolved binary markets and to the platform access conditions that applied during the observation period. It should therefore be read as a comparative analysis of observable wallet behavior, not a demographic profile of Polymarket users and not a causal estimate of why traders win or lose.
Further work could combine transaction data with voluntary wallet verification, interviews, or surveys; cluster related wallets at entity level; allow classifications to vary over time; and decompose profit into market selection, timing, spread capture, price impact, and position sizing. Counterfactual calibration could test how market quality changes when the order flow of individual groups is removed.
Sources
All links were last checked on July 12, 2026. The publication is based on the sources below; DOI links lead to the respective publisher or record.
- Wang, Z., Chao, L., Bao, Y., Cheng, L., Liao, J., & Li, Y. (2026). Polymarket Data: Complete Data Infrastructure for Polymarket.
- Wolfers, J., & Zitzewitz, E. (2004). Prediction Markets. Journal of Economic Perspectives, 18(2), 107–126.
- Arrow, K. J., et al. (2008). The Promise of Prediction Markets. Science, 320(5878), 877–878.
- Surowiecki, J. (2004). The Wisdom of Crowds. Doubleday.
- Rahman, N., Al-Chami, J., & Clark, J. (2026). SoK: Market Microstructure for Decentralized Prediction Markets.
- Saguillo, O., Ghafouri, V., Kiffer, L., & Suarez-Tangil, G. (2025). Unravelling the Probabilistic Forest: Arbitrage in Prediction Markets.
- Rothschild, D. M., & Sethi, R. (2015). Trading Strategies and Market Microstructure: Evidence from a Prediction Market.
- Kirilenko, A., Kyle, A. S., Samadi, M., & Tuzun, T. (2017). The Flash Crash: High-Frequency Trading in an Electronic Market. The Journal of Finance, 72(3), 967–998.
- Sirolly, A., Ma, H., Kanoria, Y., & Sethi, R. (2026). Network-Based Detection of Wash Trading.
- Brier, G. W. (1950). Verification of Forecasts Expressed in Terms of Probability. Monthly Weather Review, 78(1), 1–3.
- Pakdaman Naeini, M., Cooper, G. F., & Hauskrecht, M. (2015). Obtaining Well Calibrated Probabilities Using Bayesian Binning. Proceedings of AAAI, 2901–2907.
- Reichenbach, F., & Walther, M. (2025). Exploring Decentralized Prediction Markets: Accuracy, Skill, and Bias on Polymarket.
- Akey, P., Grégoire, V., Harvie, N., & Martineau, C. (2026). Who Wins and Who Loses in Prediction Markets? Evidence from Polymarket.
- Hull, J. C. (2021). Options, Futures, and Other Derivatives (11th ed.). Pearson.
- Tsang, K. P., & Yang, Z. (2026). The Anatomy of Polymarket: Evidence from the 2024 Presidential Election.
- Becker, J. (2026). The Microstructure of Wealth Transfer in Prediction Markets.

